Automated Trading
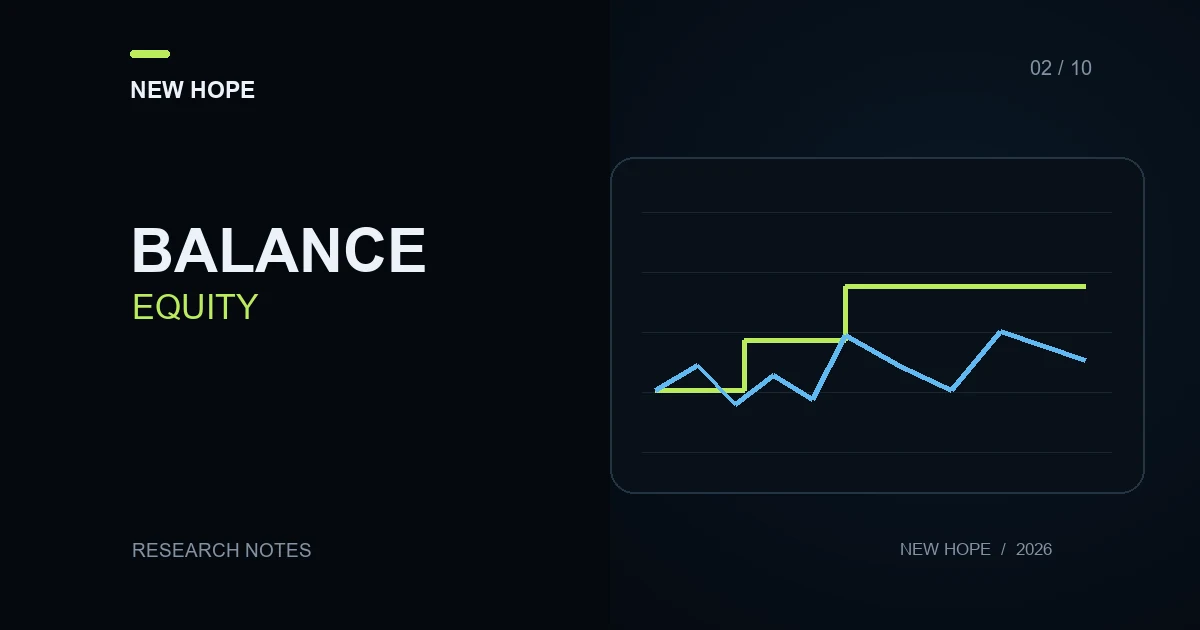
An account balance can rise while the account’s overall value falls. A bot might close profitable trades while leaving a losing position open. Understanding the report requires both the completed operations and the account’s condition at the same points in time.
The hypothetical ledger below includes an open loss and a cash deposit. It helps distinguish the curve being displayed, trading outcomes and money transferred into the account. These are educational numbers, not a New Hope account history or a return forecast.
What balance and equity represent
Balance generally reflects booked account operations, including closed-trade results and cash movements. Equity also reflects the current valuation of open positions. The actual field definition matters: the MetaTrader 5 trading-report documentation includes additional components such as credit, commissions and blocked amounts.
For the example, assume there are no credits, blocked amounts or currency-valuation adjustments. All stated closed-trade results already include costs. Under those assumptions, equity equals balance plus open-position profit or loss. This is the convention for our ledger, not a universal formula for every platform.
A ledger with closed profits and an open loss
The account starts with $10,000. Completed trades first produce $600. An open position then has a current loss of $1,400. The owner deposits $2,000 and later closes that position at its last valuation price, with no additional costs. Events occur in precisely that order.
Event | Balance | Equity |
|---|---|---|
Start | $10,000 | $10,000 |
Closed: +$600 | $10,600 | $10,600 |
Open: −$1,400 | $10,600 | $9,200 |
Deposit: $2,000 | $12,600 | $11,200 |
Closed: −$1,400 | $11,200 | $11,200 |
In the third row, balance exceeds the starting amount, but equity is already $800 below it. The fourth row makes balance look better again, although the jump comes from a deposit. Closing the position reduces balance in the fifth row but leaves equity unchanged under our assumptions: the loss was already reflected in account valuation.
The time a loss is booked therefore need not be the time its economic effect first appears. A closed-trade chart can hide the deterioration initially and reveal it later as a sudden step.
Separate trading results from deposits
The final account value is $11,200, an increase of $1,200 over the initial $10,000. After accounting for the $2,000 deposit, however, the trading result is 11,200 − 10,000 − 2,000 = −$800. The individual outcomes give the same answer: +600 − 1,400.
This ledger has one deposit and no withdrawals. A broader cash reconciliation needs separate records for deposits, withdrawals, credits and charges, with each entry identified correctly. That calculation establishes a monetary result. It does not, by itself, establish a percentage return; that requires a chosen methodology and the timing of cash flows.
A deposit is not a bot’s trading profit, and a withdrawal is not a trading loss. If a report displays percentage growth, establish how the service treats both. Two percentages calculated with different methods may not be comparable.
Where drawdown can disappear from view
Before the deposit, equity falls from $10,600 to $9,200: a $1,400 decline, or approximately 13.21% of that peak. Balance does not move during this interval. This is a practical reason to inspect the two curves together.
The MT5 testing-report documentation separates balance and equity drawdowns. For the report you are reviewing, record the curve, starting point and observation frequency. An end-of-day snapshot can miss an intraday deterioration; changing the reporting window can exclude an earlier peak.
The example identifies an observed decline, not necessarily the largest decline between snapshots. Missing history cannot be reconstructed from one final number. Similarly, a high profit factor for closed trades does not automatically describe the exposure still open.
What to request alongside the chart
The same dates for trade history, balance and equity.
Open-position snapshots at the start and end of the period.
Every deposit, withdrawal and adjustment, with timestamps and descriptions.
The reporting currency and currency-valuation rules.
An explanation of included commissions and other costs.
The chart’s update frequency and any known gaps.
Match events by timestamp. If part of a position was closed, check how that operation appears in trade statistics and in the remaining position. Start any reconciliation with a specific operation: the order, fill and cost audit helps reconstruct its monetary outcome.
Using the finding to evaluate a trading bot
Reconcile the ledger before judging the strategy. If balance rises while equity persistently trails it, identify the positions behind the gap and how long they have remained open. The gap alone does not explain the cause; you need position details, valuation prices and the sequence of operations.
For a historical report, also inspect the separation between development and out-of-sample evaluation. For a current account, establish whether the environment is simulated or live. The distinction is explored in demo versus live trading.
If you are considering NH PRO, use the NH PRO 1.5.24 manual to frame questions about configuration and supervision. Beyond asking what the bot earned, ask which positions and cash movements explain the difference between the two curves.
Related reading: context and archived report-reading examples
Different measures answer different questions. The archives below help define what to check: a percentage base, period, currency or drawdown path. Linking to a claimed result does not independently verify it.
Drawdown in banking and trading — Terminology to clarify before calculating.
The archived 130% claim — The percentage base and open positions.
The archived Black Swan 153% claim — The risk path and recovery after a decline.
The archived 105% claim — The numerator, denominator and cash flows.
The archived 34%-in-one-day claim — The boundaries of a short observation window.
The GBP report archive — Report currency and amount conversion.
More articles