Performance review
Watch a Trading Robot with Investor Access | New Hope

You have watched a software demo and seen a performance chart. The next useful question is: what happens between the trades shown in that chart? A read-only observation account helps you examine open positions, completed trades and account equity without controlling someone else's money.
This walkthrough explains how to move from a New Hope PRO report to a structured observation session. You do not need to purchase software to start learning in New Hope AREA. Report availability and observation access are shown separately in the workspace.
Get free access to New Hope AREA Already a member? Open Results
Three views of the same trading process
View | What it helps you understand | What to check next |
|---|---|---|
Software demonstration | The interface, connections and controls | Whether the demonstration matches the product and version you are considering |
Published report | Recorded performance, drawdown and trading history where available | The observation period, update date and visible data |
Investor access | The account's current state and available history | Open exposure, equity and complete trading cycles |
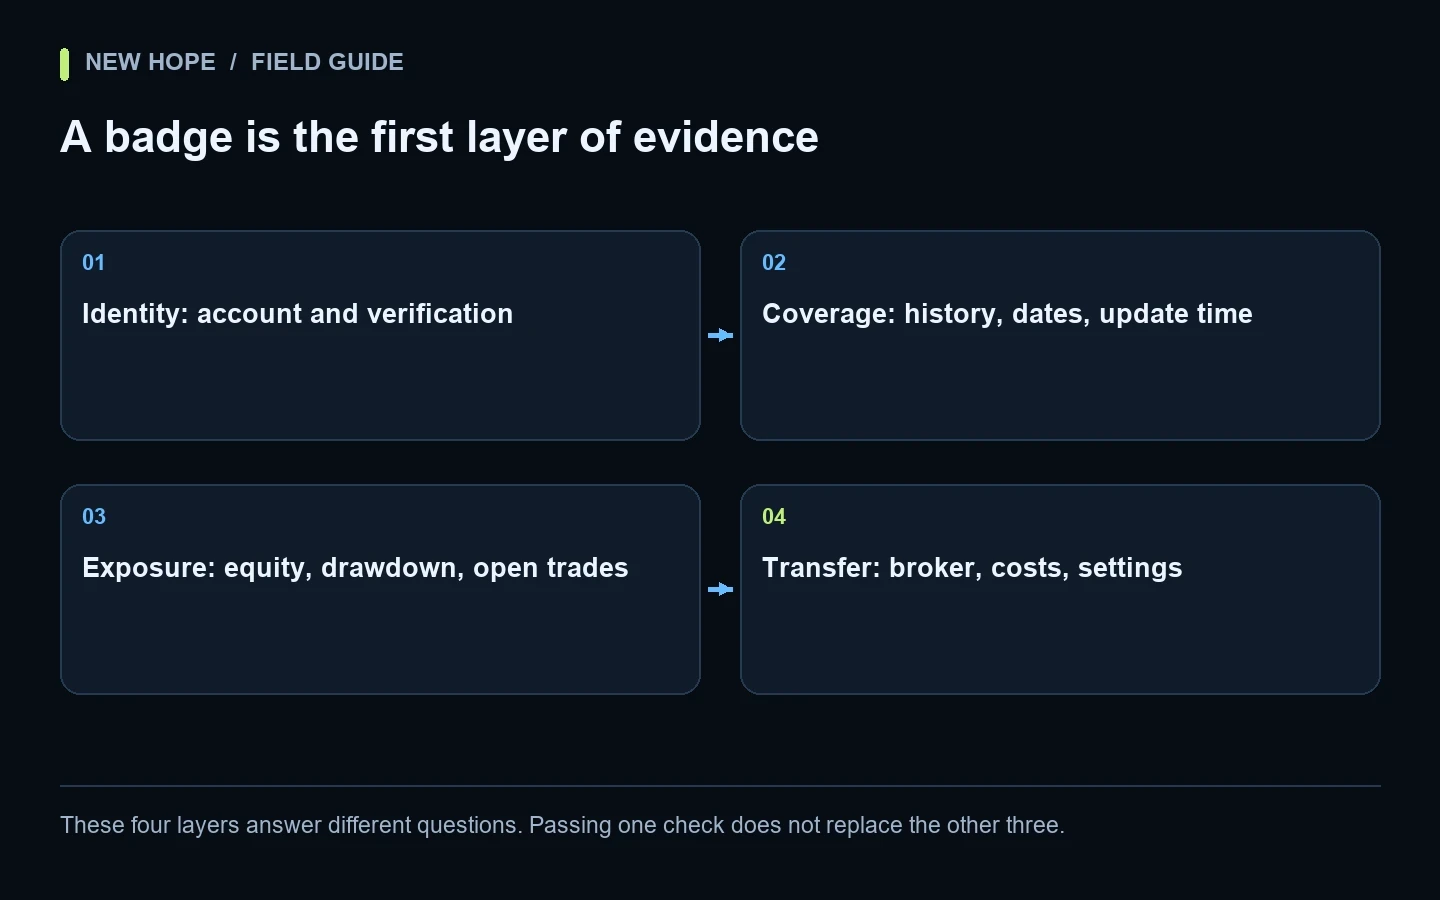
These views answer different questions. A polished interface does not establish profitability. A historical report does not show that a robot is trading at this moment. A quiet account may simply have no current signal. Start by identifying exactly what you are looking at.
What an investor password actually allows
In MetaTrader, investor access is read-only: you can inspect the account, but you cannot trade. The account number, investor password and correct server must match. The master password provides broader rights and is not needed for observation. This distinction is described in MetaQuotes' account-connection guide.
The word “investor” describes an access mode here. It does not make you an investor in that account, transfer funds or subscribe you to copy trading. Use only the observation details made available for the selected account inside AREA. Keep those details out of public comments and screenshots.
Step 1. Choose a report and write down its context
Open Results in New Hope AREA and select a New Hope PRO account. Before reading the largest number, record the broker, platform, account type, currency, period and last update. Open the original Myfxbook page when it is linked.
For a concrete example, our saved public snapshot of ExclusiveMarkets | New Hope PRO | 2026 was captured on 22 October 2026. It showed Gain of 820.69% alongside Drawdown of 82.24%. The displayed update was 17 October at 10:46. Those figures belong together; the return alone would leave out a material part of this account's history.

Original rendered Myfxbook chart from the saved public report, not an invented performance curve. Five Growth points cover 26 February to 4 March 2026. The report-level Gain was 820.69% and Drawdown was 82.24%. This is a historical example, not a current reading or a complete intraday record.
The sparse chart is a reason to inspect the underlying history, not to fill its gaps with assumptions. It cannot tell you every intraday equity low or every order event. This selected example is also not a portfolio average. For the separate question of what verification badges mean, see our Myfxbook report checklist. Myfxbook distinguishes broker-history verification from verification of trading privileges; neither badge identifies a particular robot version. Myfxbook explains the distinction here.
Step 2. Open the available observation connection
Where the workspace provides observation access, use the listed platform and server. If a web-terminal button is available, open that account's supported terminal. A generic MT5 browser terminal is not a universal gateway: MetaQuotes explains that the current web platform is assigned to a specific broker. Check the broker's supported connection when a server is unavailable. Official web-platform guidance.
Open the specified MT4 or MT5 platform and select the exact server shown on the account card.
Enter the account number and investor password in the login form. These credentials are not published in this article.
After connecting, check the account and currency, then open positions and history. Set the history to the period you want to inspect, rather than only today. If expected trades are missing, check the date range and connection.
If login fails, record the error and the account reference, then ask New Hope support to check availability. Do not switch to a trading password. A report can remain useful as a historical record even when an observation connection is unavailable.
Step 3. Watch equity and the full trading cycle
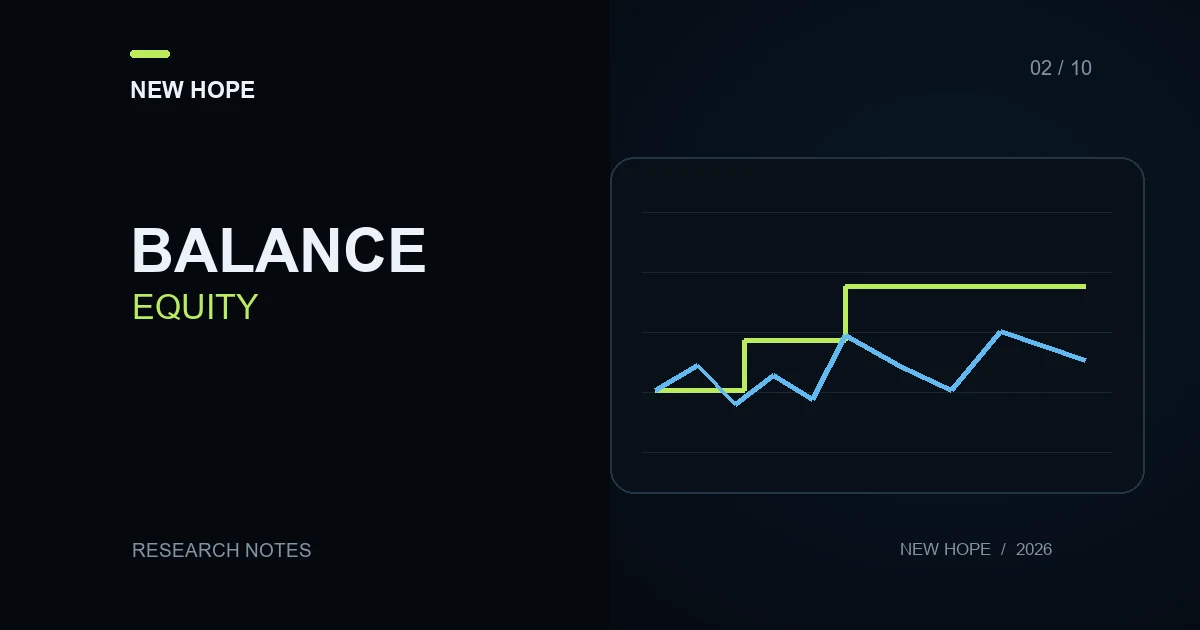
Keep three things visible: completed trades, open positions and equity. Balance reflects posted account movements. Equity also reflects the open result and applicable account adjustments. A profitable closed trade can sit beside a larger floating loss, so reading only the history tab can give an incomplete picture.
Here is a simplified teaching example, with no deposits, withdrawals or additional charges:
Moment | Balance | Open result | Equity |
|---|---|---|---|
Before partial closing | $10,000 | −$300 | $9,700 |
After realising $180 of the loss | $9,820 | −$120 | $9,700 |
Remaining position later closes at +$220 | $10,040 | $0 | $10,040 |
Illustrative arithmetic, not New Hope account performance or a simulation of a proprietary strategy. The final +$220 close is an assumed outcome, not a required recovery.
At the middle point, moving a loss from open positions into history changes balance, but not the total account value in this simplified example. The eventual cycle result is −$180 + $220 = +$40. Had the remaining position closed at −$220, the result would instead be −$400. Reopening orders can be part of a robot's process, including Smart Hidden configurations; it does not make a loss or drawdown unreal.
Step 4. Keep a small observation log
For each session, note the time, open instruments, total position size, balance, equity, completed cycle result and any connection interruption. Add a question whenever behaviour is unclear. For example: “Why did three positions close together?” is more useful than “Is this a good robot?”
Observe more than one market session and include an unfavourable period where available. A few minutes with no trades cannot establish inactivity, and one profitable sequence cannot establish reliability. Record what you actually saw rather than an annual return extrapolated from a short window.
Turn observation into a useful next step
If you understand the reports but not the controls, try the PRO startup simulator in AREA. If you understand the controls but cannot explain a trading cycle, bring the account reference and timestamps to support. If you are ready to test your own configuration, review the New Hope PRO evaluation plan and product requirements.
Explore New Hope PRO reports Request free learning access
Historical results do not guarantee future results. Trading can lose money. Observation helps you ask better questions; it does not remove execution or market risk.
More articles