Performance review
Myfxbook Verified Track Records: A Practical Review Checklist
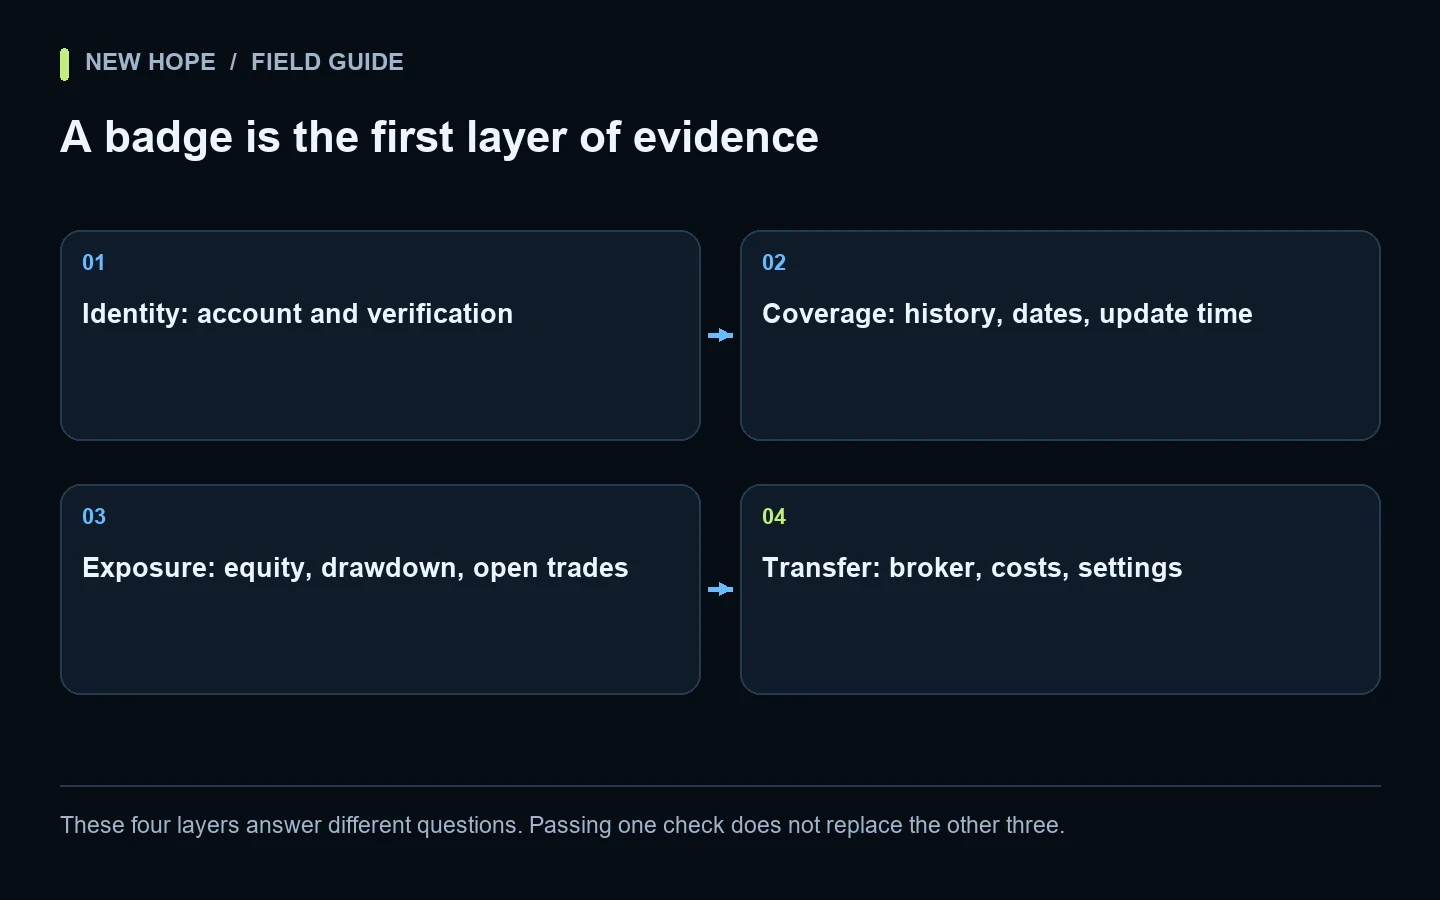
A Myfxbook link is more useful than a profit screenshot because you can inspect the surrounding record. But a verification badge does not answer every question about a trading robot. It cannot, on its own, establish suitable risk, explain open losses or show that your broker and settings will reproduce another account's execution.
A good review separates four questions: whose account is represented, how complete the observation is, what exposure produced the result, and which conditions would need to match. This checklist is a way to organise evidence, not a rating system that declares a bot safe after a certain number of ticks.
These four layers answer different questions. Passing one check does not replace the other three.
Read the two verification labels separately
According to Myfxbook's verification guide, Track Record verification concerns agreement between displayed history and the history supplied through the broker's platform. Trading Privileges verification concerns the account submitter's control through trading credentials. They answer different questions; neither is a promise about future performance.
Record the account URL and the status visible on the review date. Avoid relying on a cropped image of badges with no account address. If a badge, broker name or account type is unclear, leave that field unresolved rather than filling it from a salesperson's description. An unresolved field is a request for evidence, not automatic proof of wrongdoing.
Establish what is actually visible
Public does not necessarily mean every statistic is public. Myfxbook's permissions documentation explains that the owner selects which statistics visitors can see. Check whether balances, open positions, lots and detailed history are available. A hidden field limits your analysis even when the displayed information is genuine.
Use a small evidence table. Include account type, broker and server, account currency, first available trade, latest update, selected date range, visibility restrictions and product version if the owner provides it. Keep screenshots only as dated supporting records. The live account link should remain the primary reference so you can revisit changes.
Question | Evidence to record | If unavailable |
|---|---|---|
Is this the intended account? | URL, broker, server, account type | Ask the owner to identify it |
What period am I seeing? | Start date, filters, last update | Do not label the period complete |
What is still open? | Equity and available position details | Mark current exposure unknown |
Can I compare my setup? | Version, account conditions and sizing | Treat transferability as untested |
Check the window before judging the curve
A chart beginning after a difficult period answers a narrower question than a chart covering the full available record. That does not make a selected window useless: it may isolate a documented strategy change. The reader still needs to know why that date was chosen and what happened before it.
Myfxbook allows a custom start date and documents that earlier history remains available for analysis on public accounts. Look for the selected start date and review the broader period where accessible. If the robot, broker or sizing changed, record those boundaries instead of merging everything into one undifferentiated headline.
Also inspect the latest update. A once-impressive record that stopped updating does not describe the account today. Ask whether trading stopped, publishing failed, the account moved or the strategy changed. A gap needs context; a graph with no new points is not evidence that risk disappeared.
Use equity to test the story told by balance
Here is a hypothetical example with no deposits or withdrawals. An account begins at USD 10,000. Closed trades add USD 2,400, so its balance is USD 12,400. Open positions are losing USD 3,000, leaving equity of USD 9,400. A closed-profit headline of 24% and current account value 6% below the starting amount can both describe that same moment.
The purpose of this example is not to predict what the open positions will do. It is to show why the missing view matters. If equity is not available, the balance chart alone cannot resolve the uncertainty. Our balance versus equity guide develops this distinction with a report-reading workflow.
Ask how drawdown was observed
Myfxbook describes several drawdown measures, including equity observations at updates and end-of-day information. The headline statistic and drawdown chart do not use identical inputs. Read the metric definition before comparing numbers from different reports.
A further practical question is sampling. If an account updates periodically, a sharp equity dip between observations may not be represented by the points you see. Ask for the update method and interval, and compare with available platform evidence when intraday risk is central to the strategy. Do not turn an observed maximum into a claim that a worse temporary loss was impossible.
Duration matters too. Two accounts can show the same maximum percentage decline while one recovers quickly and the other remains below its prior high for months. Record the time under water alongside the depth. Both help explain what holding the strategy would have felt like.
Separate trading returns from cash movements
A deposit increases account value without creating trading profit. For example, moving an account from USD 10,000 to USD 15,000 by adding USD 5,000 does not demonstrate a 50% trading return. Withdrawals create the reverse presentation problem if readers compare only starting and ending balances.
Myfxbook's Gain documentation describes its time-weighted approach. Absolute Gain uses a different calculation tied to invested funds. Do not substitute one metric for another or reconstruct either from a single balance screenshot. State the exact measure being discussed and inspect the underlying cash movements.
Read the distribution, not only the win rate
Suppose a fictional system closes nine trades at USD 10 each and one trade at a USD 120 loss. Its 90% win rate coexists with a USD 30 loss before any costs omitted from those figures. Win rate alone does not explain the size of wins, the size of losses or what remains open.
Look at average and unusually large outcomes, holding periods, position sizes, exposure concentration and consecutive losses. Check whether position size expanded after losing trades. These questions help identify what requires further explanation; they do not establish the exact algorithm merely by looking at a history table.
Financing can also affect long-held positions. Compare the record's treatment of costs with the swap and rollover checklist. Avoid counting costs twice when the reported profit already includes them.
Compare trading conditions before comparing percentages
Two real accounts may use the same named robot but differ in version, presets, symbols, contract sizes, account mode, broker execution and risk allocation. Those differences can matter more than the product name. A demo account can be useful for workflow checks but is not interchangeable evidence of live execution.
Build a comparison row for each account rather than averaging incompatible results. If a result relies on separate same-symbol positions, confirm the hedging or netting model. If orders are rejected or delayed on your account, investigate that evidence before expecting the same sequence of trades.
Turn the review into five specific questions
Which robot version, presets and symbols produced the displayed period?
Was sizing changed, and are the change dates documented?
Can current equity, open exposure and complete available history be reviewed?
What explains any publishing gaps or account replacement?
Which broker and execution differences would matter for my intended setup?
Keep answers as confirmed, missing or not comparable. Avoid a numerical score that makes five minor confirmations cancel one major unknown. When operational reliability is relevant, add the restart and recovery checklist: a performance chart rarely explains how a robot behaves after an interrupted connection.
Review New Hope reports with the same standard
Open the New Hope reports page and apply the same questions to each available record. This article does not certify the present badge status or performance of every linked account. Check the account itself at the time of your review.
If you are considering NH PRO, discuss the intended broker, instrument and setup with the team and ask which record is relevant to those conditions. A useful conversation begins with a specific comparison and documented limitations, rather than the largest percentage on a chart. Historical observations can inform that conversation; they cannot guarantee the next result.
More articles