Automated Trading
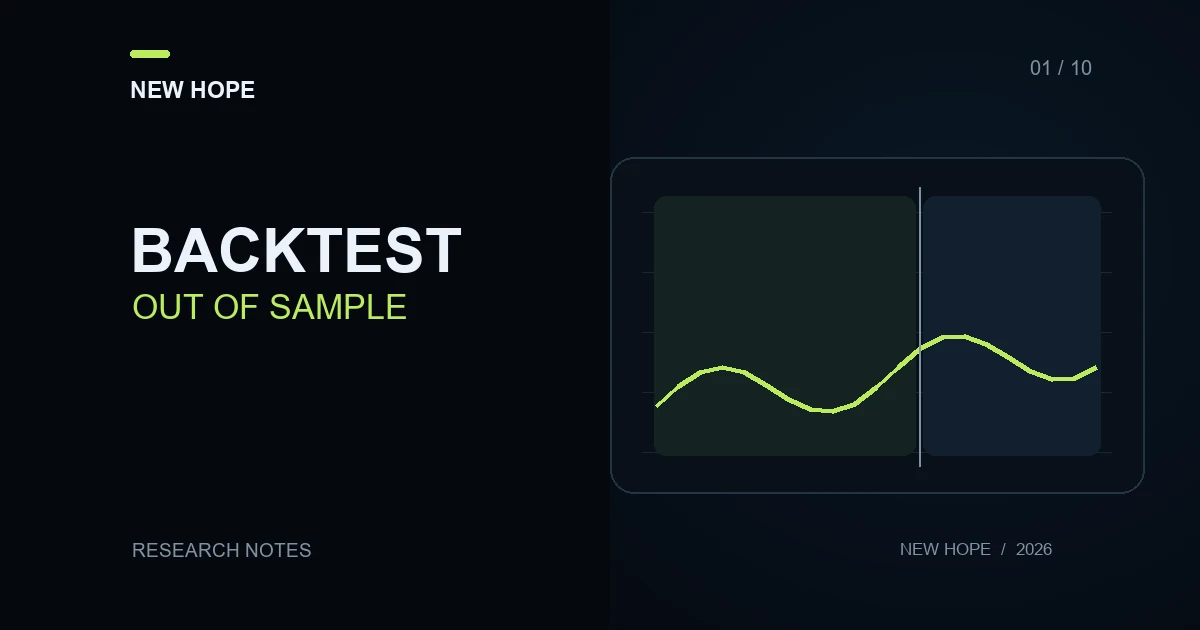
A polished backtest shows what happened under a chosen calculation model on a particular history. It does not, by itself, reveal whether the rules existed beforehand, how many unsuccessful variants were discarded or what happened on an unfamiliar period. Evaluating a trading bot therefore starts with a reproducible experiment rather than the highest return on a chart.
This protocol separates development from evaluation. Use it when discussing results with a developer or software provider. It describes a research process; it does not establish that every bot can run in a particular platform’s tester.
What in-sample and out-of-sample actually mean
In-sample data helped develop the rules or select parameters. Out-of-sample data was withheld from those decisions. Its purpose is to examine a fixed version on different observations. The QuantConnect research guide discusses overfitting and reserving a period for evaluation after development.
A file label is not sufficient. If a researcher inspects the holdout result, changes a filter and runs the test again, that period has influenced development. The rerun may be useful research, but it is no longer an independent evaluation of the original hypothesis.
An example of a chronological split
Suppose a researcher has data for 2024 and records the following process before starting. These dates illustrate organisation, not a recommended minimum testing period.
January–June: development. Investigate the hypothesis and parameter variants.
July–September: selection. Compare the predefined candidates.
October–December: final evaluation. Assess the frozen configuration.
After selection, save the software version and settings. If the final evaluation prompts a redesign, a new research cycle begins. Another independent evaluation requires data that has not influenced selection. Repeatedly revisiting the same three months until the chart looks attractive does not create fresh evidence.
Calendar length also differs from the number of independent observations. Hundreds of trades during one short market move may share a common cause. Report how trades are distributed across time and instruments, not just the number of months covered.
Keep future information out of decisions
Each decision needs a timestamp showing when its inputs became available. Consider a rule using an hourly bar’s closing price while the simulation places the trade at that same bar’s opening. The model has given the strategy information it could not yet possess. Revised historical records and indicators published with a delay need similar scrutiny.
Record the time zone and availability time of each input.
Check when the signal is calculated and when an order may be submitted.
Ensure missing-data handling and auxiliary calculations do not use the future evaluation period.
Retain the original data and preparation rules so another person can reproduce the calculation.
Record execution assumptions and costs
A price history is not automatically a history of executable trades. Specify quote sources, bid/ask handling, commissions, position financing, delays, slippage and unfinished orders. An unknown input should remain an identified uncertainty rather than silently becoming zero.
For a hypothetical sensitivity check, 60 completed trades produce $540 before a separate execution-cost allowance. An assumed $5 per completed round trip leaves $240: 540 − 60 × 5. At $10, the result is −$60. This changes one assumption while holding trades fixed; a fuller execution model could also change the trades themselves. Do not subtract a cost again if the selected report field already includes it.
The MetaTrader 5 tester documentation describes historical testing conditions and simulated execution delay. Platform facilities do not establish third-party software compatibility or automatically reproduce every live execution effect. For completed operations, use the guide to reconciling orders and actual fills.
Look beyond the final profit
For each period, retain trade count, active days, results after the stated costs, positions left open at the boundary and the account-value history. Profit factor helps unpack aggregate gains and losses but cannot replace the other fields. Comparing balance with equity shows whether closed-trade results conceal an open-position loss.
Keep every researched variant, including unsuccessful ones. A winning report without its selection history does not reveal how many attempts produced it. A sharp deterioration after a small parameter change calls for investigation; deleting the inconvenient run does not resolve the question.
A compact test record
Purpose: the hypothesis and the observation that would count against it.
Reproducibility: software version, settings, data source and dates.
Separation: periods used for development, selection and final evaluation.
Execution: included costs and constraints, plus unresolved assumptions.
Full picture: all candidates, open positions and both account-value curves.
Conclusion: what was observed and which question remains unanswered.
A historical holdout is not real-time trading. The next type of comparison is explained in demo versus live trading. When considering NH PRO, send a question about your intended configuration: include the platform, instrument and specific result you want to examine. A successful historical test does not establish future profitability.
More articles