Testing & market data
Tick Data vs Candles: Why Backtest Results Can Change
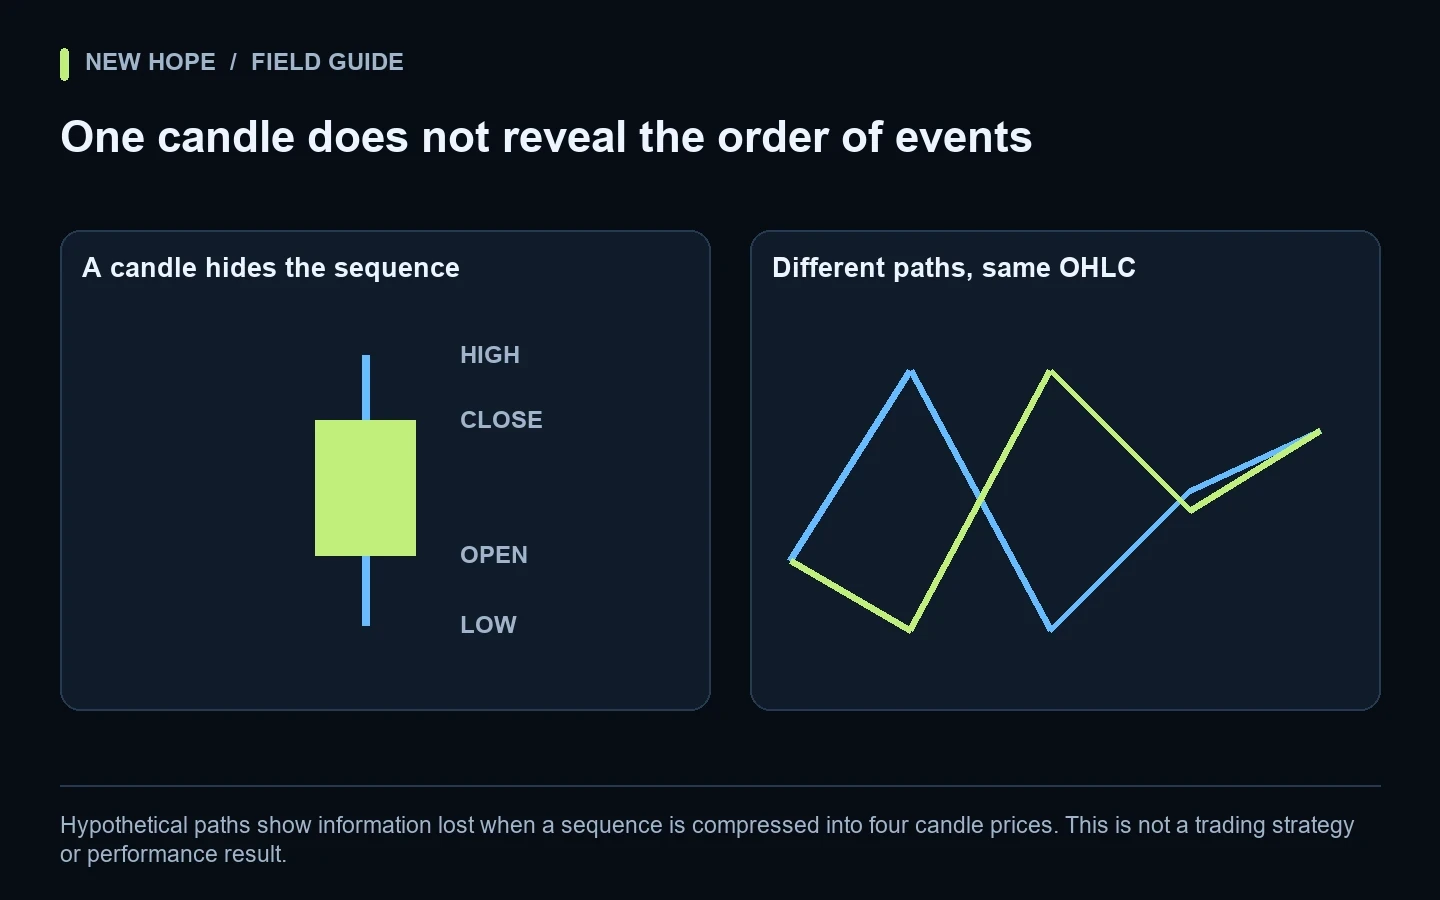
A backtest can use the right date range and still answer the wrong question. If a strategy reacts to events inside a candle, four prices may not describe enough of what happened. A change from candle data to tick data can therefore change the sequence of signals and exits without changing the visible chart very much.
This guide focuses on the input data, not on finding attractive settings. It uses MetaTrader 5 testing modes as a documented example. It does not imply that every external trading program, including NH PRO, can be loaded into MT5's Strategy Tester.
Hypothetical paths show information lost when a sequence is compressed into four candle prices. This is not a trading strategy or performance result.
What a candle keeps—and what it leaves out
An OHLC candle summarizes open, high, low and close for a period. Those values describe boundaries and endpoints. They do not uniquely identify the path between them, how long the market spent at each price, or every quote change.
That distinction may be unimportant to a rule that only examines completed bars and deliberately waits until a later event to act. It can be central to a rule that reacts to a brief threshold crossing or manages a position inside the bar. The first task is to identify the event your rule actually needs.
Do not choose a testing mode simply because it finishes faster or produces a smoother result. Choose it because the data can represent the decisions being evaluated, and document any remaining approximation.
Worked example: identical OHLC, different first touch
Consider a hypothetical candle with open 100, high 106, low 94 and close 102. Two possible paths are:
Path | Price sequence | First illustrative threshold reached |
|---|---|---|
A | 100 → 106 → 94 → 102 | Upper threshold 105 |
B | 100 → 94 → 106 → 102 | Lower threshold 95 |
Both paths produce the same candle. Suppose a simplified test ends an observation at the first threshold touch. It will label the two sequences differently. The candle alone cannot tell the reviewer which label is correct.
This example deliberately ignores bid/ask differences, execution delays, costs and gaps. It is not a simulation of a complete trade. Its purpose is narrower: once a sequence has been compressed, the missing order of events cannot be recovered merely by looking at the candle more carefully.
When a backtest resolves this ambiguity through a modelling rule, record that rule. An attractive result that depends on a favorable assumed sequence should not be presented as a confirmed historical event.
Recorded ticks and generated ticks are not the same input
MetaTrader 5 distinguishes modes based on bar prices, generated tick sequences and real tick history. “Every tick” and “Every tick based on real ticks” should not be treated as identical labels. The platform's real and generated tick documentation explains their different data paths.
Input representation | Useful question | What still needs review |
|---|---|---|
Candle prices | Can the rule be evaluated at bar boundaries? | Unobserved intrabar sequence |
Generated tick path | How does the model behave between bar points? | Assumptions used to generate that path |
Recorded ticks | How did the available event stream evolve? | Coverage, origin, timestamps and missing records |
More detailed data reduces certain ambiguities; it does not certify future performance. A recorded stream is still a particular provider's record for a particular instrument and period. It is not a recording of every possible venue or every order the future strategy will submit.
Price-side differences can hide behind a familiar chart
A candle chart is not a complete execution record. The price that forms a bar, the price that triggers a condition and the price at which an order is filled can serve different purposes. MT5's testing-features documentation describes instrument-dependent trigger and execution behavior.
For a review worksheet, create three separate fields: observed price, trigger reference and assumed execution price. If the analysis uses a single field named “price” for all three, ask which distinctions have been collapsed.
For example, an apparent touch on the displayed chart may not establish that the required side of the quote reached a threshold. Equally, a valid trigger does not prove an order would fill at exactly that level. Treat these as separate assumptions, not as a single success condition.
A controlled comparison between testing modes
Fix the software build, parameters, account assumptions, instrument and date range.
Write down which strategy events depend on intrabar ordering.
Run the selected modes without changing the parameters to favor any result.
Locate the first event where the runs diverge.
Compare available input records, trigger references and model assumptions around that event.
Classify the difference before summarizing performance.
The first divergence is often more useful than the final profit difference. Once two runs hold different positions, many later outcomes may differ for secondary reasons. Starting at the final balance can send the investigation in the wrong direction.
Keep a discrepancy table with one row per explained cause: missing event order, different quote coverage, price-side assumption, changed input or unresolved issue. An unresolved issue should remain visible in the report instead of disappearing into an average.
Data quality is a checklist, not one percentage
Origin: which provider, server and exact symbol supplied the data?
Coverage: does the intended interval contain gaps or an unexpected start date?
Time: are event timestamps and session boundaries understood?
Quotes: are the price fields needed by the strategy actually present?
Specifications: do contract assumptions match the test being described?
Repeatability: can another reviewer reproduce the run from the recorded inputs?
Inspect the tester log as well as the result summary. MetaQuotes describes the preparation and history steps in its testing journal guide. Preserve relevant log entries with the report so a later data refresh does not leave you unable to explain an older run.
Keep data realism separate from statistical robustness
A detailed dataset does not prevent overfitting. You can select settings too aggressively on high-resolution data just as you can on candles. Conversely, a clean out-of-sample split does not repair a data representation that cannot express the strategy's required events.
Use the out-of-sample review protocol for chronological separation and parameter decisions. Use this article to review what the simulation actually observed. Both checks are necessary, but they answer different questions.
After a simulation review, the demo-versus-live comparison provides a way to record environment differences. For actual orders, use the execution audit. Neither stage turns a historical result into a guarantee.
What to ask when software uses external feeds
If a system reacts to more than one source, a single broker's candle history may not describe all its inputs. Ask what data the test included, how clocks were aligned and whether the reported run used the same decision logic as the live application. If those details are missing, describe the result as incomplete evidence.
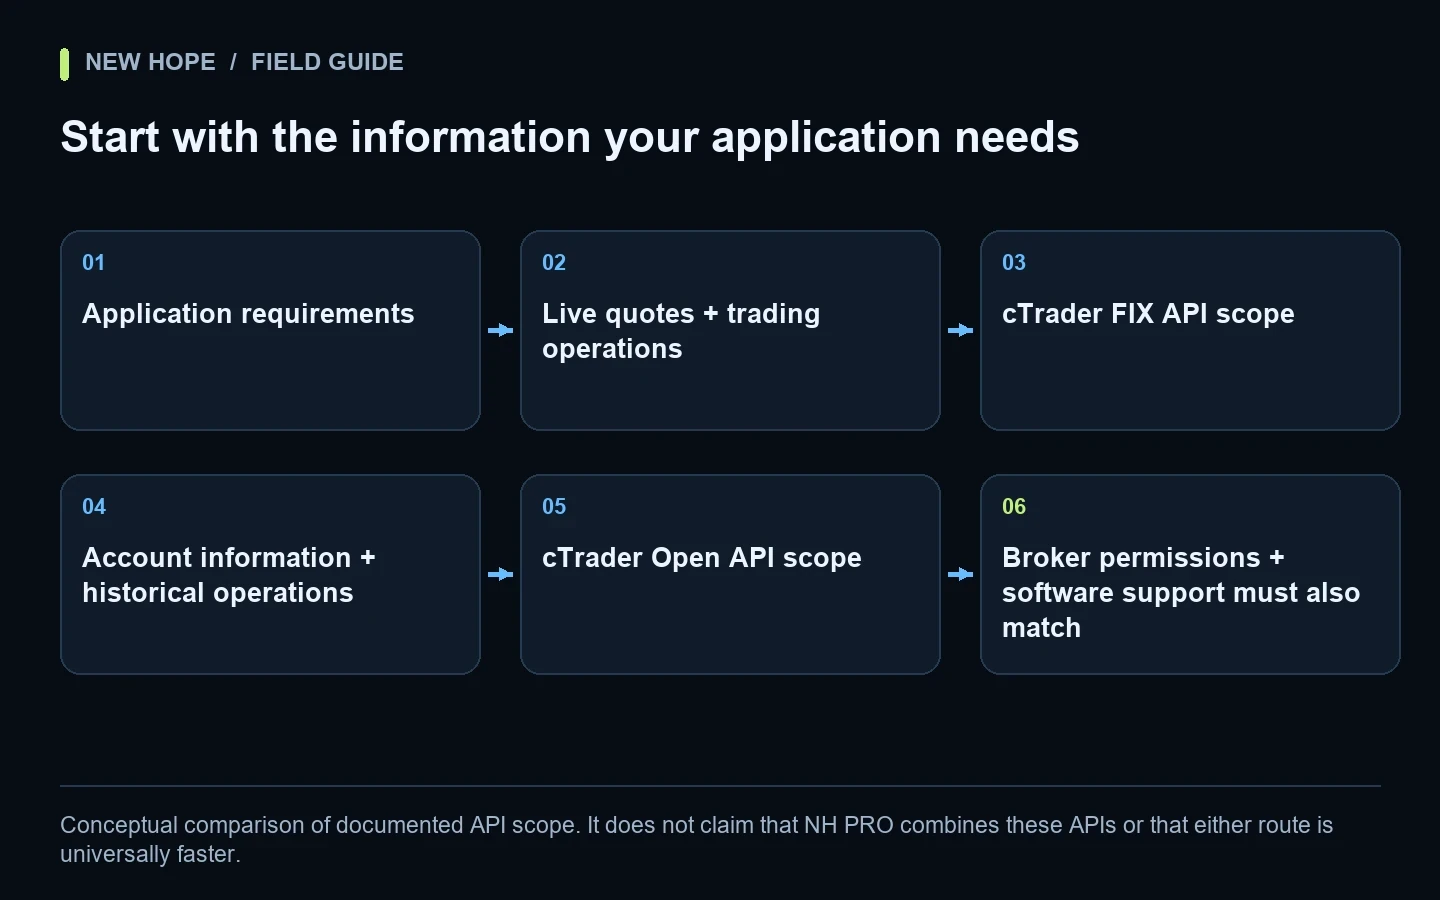
The fast-feed evaluation guide explains why quote arrival and executed fills must be distinguished. The cTrader API comparison also shows why a connection's ability to provide current prices does not establish access to historical data.
NH PRO supports several connection types and requires a suitable broker and configuration. Before evaluating a particular setup, review the product details and ask the team which testing method is appropriate for that exact configuration.
Related product demonstration
The accompanying NH PRO video opens at the discussion of recording broker and feed ticks. It provides product context, not an MT5 backtesting demonstration. The discussion also notes delayed recording output; do not treat an exported file as a live redistributable feed or assume it reproduces all inputs required for a simulation.
Frequently asked questions
Are real ticks always enough?
No. Their origin and coverage still matter, and a simulation must still model the decisions and execution assumptions it claims to test.
Should every difference be treated as a software bug?
No. First determine whether the two runs supplied equivalent information. Different input representations can legitimately produce different decisions.
Can I trust a result because the chart looks realistic?
A plausible chart is not a reproducible test record. Keep the input specification, event-level explanations and limitations beside the performance summary.
Related video
Watch the referenced video on YouTube
More articles